Aggregate Demand & Aggregate Supply
Written by Elin Thomas and Swati Bisht.
Aggregate Demand:
Components of aggregate demand:
Aggregate Demand = Consumer spending + Capital Investment + Government Spending + (Exports – Imports)
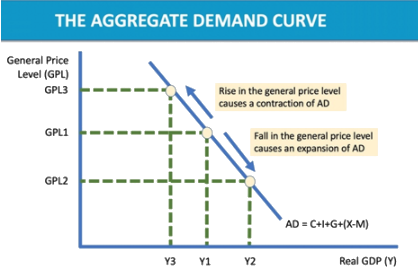
AD = C + I + G + (X-M)
(C) Consumer Spending – Spending by households on goods and services, the biggest component of aggregate demand in the UK. Disposable income is the income available for a consumer to spend, how much they choose to spend is measured in the marginal propensity to consume (MPC), equal to the change in consumer spending divided by change in disposable income.
Generally, the lower someone’s income the higher their MPC – however a household’s propensity to consume is also influenced by:
- Changes in real disposable incomes (changes in wage rates, indirect taxes, etc)
- Changes in employment and job security
- Availability of credit (if interest rates are low and it is cheap to borrow and there is low incentive to save MPC is likely to increase)
- Cost of servicing a mortgage (the larger the monthly payments the lower the MPC)
- Changes in asset prices (the wealth effect where if someone’s stock of assets such as their property increases in value their confidence is likely to increase and they will spend more)
- Expectations of future price changes (e.g. if there is deflation, they may wait for prices to further decrease, thus decreasing their MPC)
- Consumer confidence (‘animal spirits’, where talk and emotions influence how confident the consumer is in the economy and therefore in their spending) – when consumer confidence is low, they are more likely to save not spend
(I) Capital Investment – Spending on capital goods such as equipment and factories which increases the production of consumer goods in the future, including spending on improving the human capital of the workforce through training and education, lots of this spending goes into technological advances. The amount of capital investment affects competitiveness in a globalizing world.
Most investment is done by private sector businesses and some from the government in market-based economies into infrastructure (spending on new roads, railways, etc) such as the High-Speed Rail project in the UK.
- Gross Investment: The total amount that the economy invests in the capital.
- Net Investment: The total amount that the economy invests in capital minus capital depreciation.
- Capital Depreciation: How much of the investment is spent just replenishing goods that have deteriorated over the year.
If the net investment is positive (gross investment is higher than depreciation), businesses will have an increased production capacity and should be able to meet rising demand in the future.
An increase in capital spending has a positive multiplier effect as it increases the demand for industries that manufacture the technology/hardware/construction companies.
- Multiplier Effect: The idea that an initial increase in spending can lead to an even greater increase in national income, therefore an initial change in aggregate demand can cause a further change in the aggregate output of the economy. It is equal to 1 / (1-MPC).
Investment can create or destroy jobs; it creates jobs in the production/installation of new technology etc but can cost the jobs of those replaced by capital machinery.
In relation to aggregate supply and demand, there will be a ‘lag time’ between the investment and the point at which aggregate supply actually increases (it takes time for things to be built or for workers to be educated). Also, if there is insufficient demand it may be there is excess capacity in the economy and therefore there will be downward pressure on prices and profits.
Investment is influenced by:
- Interest rates, if they are low it is cheaper to borrow and there is less incentive to save the money so there will be a higher number of investments. If interest rates are high it is more expensive to borrow and there may be a better return on their money if they just save it in a bank, therefore there will be less investment.
- Risk, if there is high uncertainty perhaps in times of volatility then investments may fall as future demand is uncertain.
- The rate of demand increase in the market, if consumer spending is increasing businesses are more likely to invest in capital goods as they will need to increase output to accommodate the increased demand. As well as this their profits will be higher so they have the money to invest in capital.
- Corporation Tax, if the government reduces taxes there will be a greater incentive to increase profits as the business will receive more per unit sold and therefore investments will increase.
- Technological change and market competition, if the technology is rapidly developing it may be the case that businesses have to constantly invest in improvements just to keep up with the market – for example in the market for smartphones.
- Business Confidence or animal spirits, during a downturn many businesses may postpone investment as they don’t believe that demand will be high enough for the increase in supply and therefore it will only decrease price level and therefore profits.
- Social Costs and Benefits, this tends to occur in the public sector where the economic and social impacts of an investment will be considered before anything is invested.
(G) Government Spending - The spending on state-provided goods and services such as public goods and merit goods.
The government spending will depend on the developments in the economy (such as in a recession there may be spending in order to directly increase consumer spending and thus aggregate demand, whereas in a time of economic prosperity government spending is more likely to be aimed at capital goods and increasing the productive potential of the economy) and any political priorities of the government. It can be split into current spending and capital spending:
- Current spending – providing public services such as the road maintenance budget.
- Capital spending – new public infrastructure such as the construction of new roads.
Government spending is a key component of aggregate demand, has a large regional economic impact, provides public and merit goods, and can help achieve greater equity in society.
Government spending can impact incomes either by welfare state transfers such as state pensions or state-provided services such as education.
(X-M) Net Exports – The injection to the circular flow of exports sold overseas minus the withdrawal of goods imported from overseas.
When net exports are positive, there is a trade surplus which adds to aggregate demand. When net exports are negative, there is a trade deficit that takes away from aggregate demand – most developed economies such as the UK run a trade deficit.
In times of economic prosperity and strong currency for the UK for example, imports will be high as the average income is high and imports are relatively cheaper. However, to the UK’s trading partners UK produced products will be relatively more expensive as the pound is strong and therefore exports will decrease resulting in negative net exports. The opposite would occur if the UK’s trading partners such as Germany were experiencing economic prosperity and the UK wasn’t.
The Aggregate Demand Curve:
The AD curve shows a relationship between aggregate demand (real GDP) and the general price level.
A change in the general price level causes movement along the aggregate demand curve, when there is a fall in the general price level there is an expansion in aggregate demand and when there is a rise in general price level there is a contraction in aggregate demand:
A change in aggregate demand will cause a shift in the aggregate demand curve, an increase in aggregate demand will cause the curve to shift rightwards/outwards and a decrease in aggregate demand will cause the curve to shift leftwards/inwards:

A change in any of the components of aggregate demand (consumption, government spending, investment, and net exports) will cause a shift in the aggregate demand curve.
Aggregate Supply
In economics, aggregate supply is the total supply of goods and services that firms in a national economy plan to sell during a specific time period. It is the total amount of goods and services that the firms are willing to sell at a given price level in the economy. Aggregate supply gives the relationship between the price level and the production of the economy. Firms make decisions about what quantity to supply based on the profits they expect to earn. They determine profits, in turn, by the price of the outputs they sell and by the prices of the inputs, like labor or raw materials, that they need to buy.
What is short-run aggregate supply?
Short-run aggregate supply shows the total planned output when prices can change but the prices and productivity of factor inputs e.g. wage rates and the state of technology are held constant.
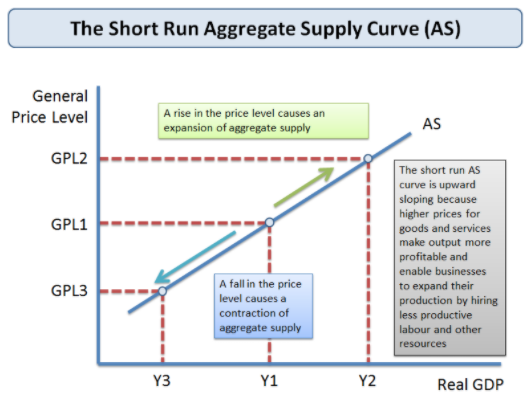
Short Run Aggregate Supply Curve
A change in the price level brought about by a shift in AD results in a movement along the short-run AS curve. If AD rises, we see an expansion of SRAS; if AD falls we see a contraction of SRAS.
What is long-run aggregate supply?
Long-run aggregate supply shows the total planned output when both prices and average wage rates can change – it is a measure of a country’s potential output and the concept is linked to the production possibility frontier
In the long run, the LRAS curve is assumed to be vertical (i.e. it does not change when the general price level changes)
In the short run, the SRAS curve is assumed to be upward sloping (i.e. it is responsive to a change in aggregate demand reflected in a change in the general price level)
Components:
The main components of aggregate supply are two, namely, consumption and saving. A major portion of income is spent on the consumption of goods and services and the balance is saved. Thus, national income (Y) or aggregate supply (AS) is sum of consumption expenditure (C) and savings (S).
AS = C + S, i.e., Y = C + S
AS curve is artificially represented by a 45° line from the origin, why? Because every point on this line is equidistant from X-axis and Y-axis taking the same scale on both the axes, i.e., each point on the line indicates Expenditure (AD) = Income (AS).
Thus 45° line (also called a Guideline) helps us to identify equilibrium when two variables are to be shown graphically equal. That is why AS curve is represented by a 45° line so that when AD curve intersects it, AD becomes equal to AS. Thus, every point on the 45° line represents AD = AS (i.e., equilibrium).
Again, the 45° line implies that the sum of consumption and saving (C -I- S) is always equal to the level of income (Y). Another point to be kept in mind is that since technology is assumed to be constant during a short period, output (or aggregate supply) can be increased only by employing more resources, mainly labor. Thus, aggregate supply increases in direct proportion to an increase in employment.
Classical and Keynesian Concepts of Aggregate Supply:
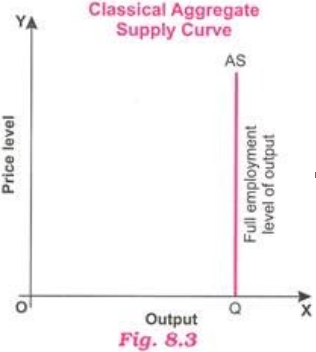
Classical Concept of Aggregate Supply:
According to Classical, aggregate supply is perfectly inelastic with respect to a price level which means changes in price level have no effect on aggregate supply. It is due to J.B. Say’s law of market and wage-price flexibility. As a result, Classical aggregate supply a curve is a vertical line parallel to the Y-axis at full employment level of output
The curve AS is the aggregate supply and the OQ distance on the X-axis is the full employment level of output. Clearly, the vertical shape of the aggregate supply curve indicates that changes in price level have no effect on aggregate supply because the full employment level of output remains the same at OQ.
Keynesian Concept of Aggregate Supply:
In the Keynesian approach, aggregate supply is perfectly elastic with respect to price level till full employment level of output. It means firms are willing to produce any amount of output at the prevailing price level till the full employment level of output is reached.
Beyond this point, further increase in production is not possible because all resources in the economy are already fully employed (used). As a result, aggregate supply curve AS, then, becomes perfectly inelastic at full employment level of output as shown in the adjoining Fig. 8.4. Aggregate demand determines the levels of output, income, and employment as the level of aggregate supply is constant and given in the short-run.

Shifts in Short-Run Aggregate Supply (SRAS)
Shifts in the position of the short-run aggregate supply curve in the price level/output space are caused by changes in the conditions of supply for different sectors of the economy:
Employment costs e.g. wages, employment taxes. Unit labor costs are also affected by the level of labor productivity
Costs of other inputs e.g. commodity prices, raw materials. The exchange rate can affect the prices of key imported products
Impact of government e.g. environmental taxes such as carbon duties & business regulations which affect the costs of production
What are the main causes of shifts in aggregate supply?
The main cause of a shift in the aggregate supply curve is a change in business costs – for example:
1.Changes in unit labor costs - i.e. labor costs per unit of output
2.Changes in other production costs: For example rental costs for retailers, the price of building materials for the construction industry, a change in the price of hops used in beer making, or the cost of fertilizers used in farming.
3.Commodity prices Changes to raw material costs and other components e.g. the prices of oil, natural gas, electricity copper, rubber, iron ore, aluminium, and other inputs will affect a firm’s costs
4.Exchange rates: Costs might be affected by a change in the exchange rate which causes fluctuations in the prices of imported products. A fall (depreciation) in the exchange rate increases the costs of importing raw materials and component supplies from overseas
5.Government taxation and subsidies:
An increase in taxes to meet environmental objectives (known as green taxes) will cause higher costs and an inward shift in the SRAS curve – for example a higher price for carbon emissions
Lower duty on petrol and diesel would lower costs and cause an outward shift in SRAS
6.The price of imports:
Cheaper imports from a lower-cost country have the effect of shifting out SRAS
A reduction in an import tariff on imports or an increase in the size of an import quota will also boost the supply available at each price level causing an outward shift of SRAS
