Demand and Supply
Written by Togzhan Batyrbekova
Demand
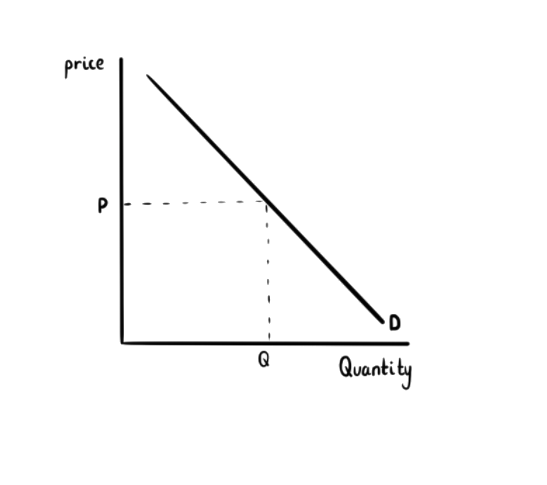
Demand is the willingness and ability of consumers to buy a certain good or service at a certain price. It can be represented on a diagram:
Analyzing the diagram:
As you can see in the diagram above, the Y-axis is labeled as price and the X-axis is labeled quantity, thereby showing the relationship between them.
The demand curve is downward sloping. This is because, at a higher price, people are less likely to purchase a good or service, as it is more expensive. Accordingly, when the price is lower, people are more likely to buy a good or service.
Contractions and expansions in demand:
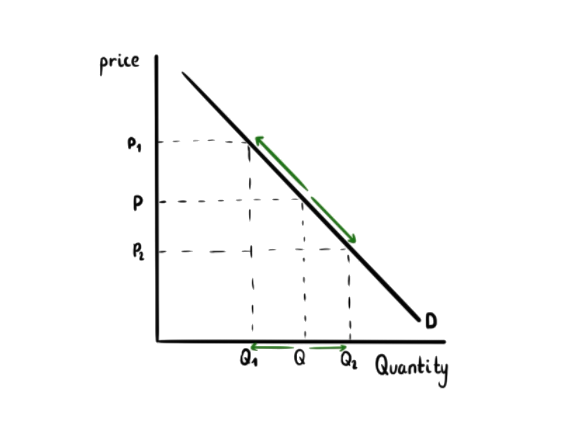
A contraction in demand is a fall in the quantity demanded of a good or service that is caused by a rise in price. An expansion in demand is a rise in the quantity demanded of a good or service that is caused by a fall in price. Note here, that a change in the price is the ONLY factor that can cause a contraction or expansion.
Demonstrated graphically:
Analyzing the diagram:
On the diagram above, a contraction can be seen by the movement from QP to Q1P1. As you can see, the movement happens along the demand slope, while the slope itself remains unchanged.
An expansion can be seen by the movement from QP to Q2P2
Increases and decreases in demand:
An increase or decrease in demand means that there is a change in the quantity demanded at every price. E.g an increase in demand means that there is more quantity of a good/service demanded at every price. Increases and decreases in demand are caused by outside factors, some of which are:
Income- when people have higher incomes, they can spend more money, causing the demand to increase
Advertisement- more promotion, exposure, causes more demand
Fashion- people often choose to buy the latest trends and fashions
Population - more people causes more demand
Weather - some items have seasonal demand, like some items of clothing
Availability of credit - the more available and cheaper the credit, the more people can afford to buy items, increasing the demand
Substitutes - items that are substitutes for each other, can o influence each other’s demand. For example, if the price for strawberry jam increased, the demand for blueberry jam would increase because people would switch to buying the cheaper product.
Complements- similarly, items that are complements of each other, e.g PlayStation disks and PlayStation consoles, will also influence each other’s demand. If for example, the price of the PlayStation rises, the demand for PlayStation disks would fall.
On a graph:
Analyzing the diagram:
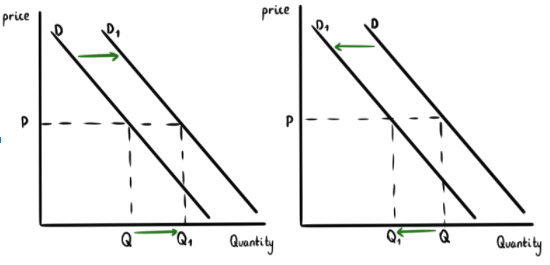
The diagram on the left shows an increase in demand, by a shift in the demand curve from D to D1.
As can be seen, though the price remains at P, the quantity demanded increases from Q to Q1
The diagram on the right shows a decrease in demand, by a shift in the demand curve from D to D1.
The price remains at P but the quantity demanded decreases from Q to Q1
Price elasticity of demand
Price elasticity of demand is the measure of the responsiveness of demand to a change in price. If demand is elastic, that means that it will be responsive to a change in price. If it is inelastic, it will not be very responsive to changes in price. Perfect elasticity is when even the slightest change in price causes the quantity demanded to drop to 0. Perfect inelasticity is when at any price, the quantity demanded will remain the same.
The Price elasticity of demand (PED) is calculated by:
PED= %change in quantity demanded/ % change in price
The value you get will determine how elastic the demand is:
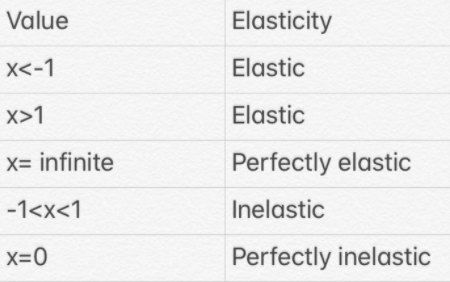
NOTE: The PED is almost always negative (unless it is a special case) because the relationship between the quantity demanded and the price in inverse. However, sometimes the negative sign is dropped
PED on a diagram:

Supply
Supply is the number of goods and services a producer is willing to sell at any given price. Supply on a diagram:

Analyzing the diagram:
Similarly to the demand diagram the axis are also price and quantity.
The supply curve, however, is upward sloping. This is because, at a higher price, producers are willing to supply more of a good or product, as higher prices bring more profit. They are less willing to supply at lower prices as it brings them a smaller profits.
Contractions and expansions in supply:
A contraction in supply is a fall in the quantity supplied of a good or service that is caused by a fall in price. An expansion in supply is a rise in the quantity supplied of a good or service that is caused by a rise in price. Note here once again, that a change in the price is the ONLY factor that can cause a contraction or expansion.
On a diagram:

Analyzing diagram:
On the diagram above, an expansion can be seen by the movement from QP to Q1P1. As you can see, the movement happens along the demand slope, while the slope itself remains unchanged.
A contraction can be seen by the movement from QP to Q2P2
Increase and decrease in supply:
An increase or decrease in supply means that there is a change in the quantity supplied at every price. E.g an increase in supply means that there is more quantity of a good/service supplied at every price. Increases and decreases in supply are caused by outside factors, including (but not limited to):
Costs of production- if costs of production drop, that means the firm can produce more goods and services
Weather- some items are produced by season, for example, fruits, and vegetables
Technology- developments in technology mean that production can become cheaper, quicker, and more efficient increasing the number of goods that can be produced
Related goods- the production of some goods are linked, for example, leather and meat. If more meat is produced, then the supply of leather can increase as a consequence
Expectations- if producers expect a rise in demand for a good or service, they may increase the supply as a response.
Profitability in other industries- if other industries are more profitable, a firm may switch to those industries.
Taxes and subsidies- a tax is a charge made by the government, while a subsidy is a grant given by the government. If there are many taxes on a firm, they may not be able to produce as much. Meanwhile, if a firm is given a subsidy, they have more money to produce more goods and services, increasing the supply.
Increase and decrease of supply in a diagram:

Analyzing diagram:
The diagram on the left shows an increase in supply, by a shift in the supply curve to the right from S to S1.
As can be seen, though the price remains at P, the quantity supplied increases from Q to Q1
The diagram on the right shows a decrease in the supply, by a shift in the supply curve to the left from S to S1.
The price remains at P but the quantity supplied decreases from Q to Q1
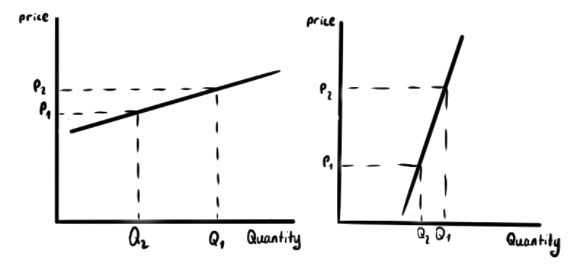
Price elasticity of supply:
Price elasticity of supply is the measure of the responsiveness of supply to a change in price. If supply is elastic, that means that it will be responsive to a change in price. If it is inelastic, it will not be very responsive to changes in price. Perfect elasticity is when even the slightest change in price causes the quantity supplied to drop to 0. Perfect inelasticity is when at any price, the quantity supplied will remain the same.
The Price elasticity of supply (PES) is calculated by:
PES= %change in quantity supplied/ % change in price
The value you get will determine how elastic the supply is:

Elasticity of supply on a diagram