Production Possibility Curve
Written by Amina Shafkhatova | Proofread by Yasmin Uzykanova
The Production Possibility Curve (PPC) is an economic model that examines the highest potential output that a country can achieve by utilizing all of its factors of production to create two goods or services. This model can be illustrated using any two goods or services.

In many cases, the axes of a PPC diagram represent capital goods and consumer goods. Capital goods refer to assets that aid firms or nations in generating output, such as a robotic arm in a car manufacturing company. On the other hand, consumer goods are final products that do not possess any future productive use like a watch.
The Production Possibility Curve (PPC) is an economic model that illustrates the maximum output an economy can generate using all of its resources or factors of production. The PPC depicts all possible combinations of goods and services that can be produced with these resources.
Additionally, the PPC demonstrates the concept of opportunity cost, which occurs when producing more units of one good requires sacrificing the production of some units of another good due to limited resources. For example, moving from point C (120, 150) to D (225, 100) means producing an additional 105 units of consumer goods at the expense of 50 units of capital goods.
Any change in the allocation of existing resources within an economy results in a shift in the PPC.
Moreover, the PPC reveals the efficiency and attainability of production.
Producing at any point on the curve indicates productive efficiency, whereas any point inside the curve signifies inefficiency, as seen in point E.
By utilizing the current available resources, attainable production is possible at any point on or inside the curve. In contrast, any point outside the curve is unattainable, as shown in point
Increasing and Constant Opportunity Cost
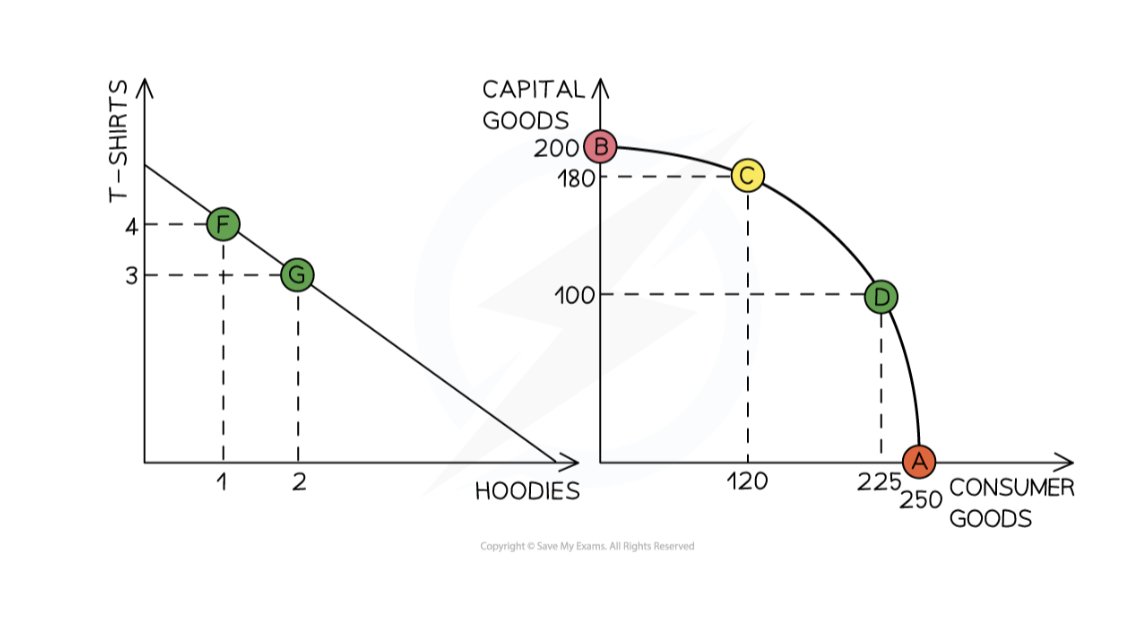
Constant opportunity cost (1st graph) occurs when all the factors of production can be altered between two goods without any loss or wastage of resources. This means that giving up one unit of good results in gaining one unit of the other.
This means that giving up one unit of a good results in gaining one unit of the other.
Conversely, increasing opportunity cost (2nd graph) arises when the factors of production cannot be effortlessly switched between the two goods due to differences in their adaptability to resources.
In such situations, giving up one unit of good results in gaining less than one unit of the other good. This occurs because resources are not equally efficient in producing both goods, which leads to diminishing returns when switching from one good to another.
Graph Analysis:
If a country is producing only T-shirts and hoodies, the factors of production, such as labor and land (cotton), can be efficiently utilized to make both products. Therefore, in this scenario, there is a constant opportunity cost. This means that the country can produce either T-shirts or hoodies without wasting resources, and the cost of producing one good remains the same regardless of how much of the other good is produced.
However, when a country is producing consumer goods and capital goods, the factors of production cannot be easily shifted between the two products. For instance, the labor required to make a washing machine may not have the skills to produce a robotic arm used in car manufacturing. Therefore, in this scenario, there is an increasing opportunity cost. As the country produces more capital goods, the cost of producing additional consumer goods increases because the resources used to make capital goods are not ideally suited for producing consumer goods. This leads to a higher opportunity cost of producing consumer goods as more capital goods are produced.
Changes in Production Possibilities
An entire curve can shift outwards or inwards

An economy experiences economic growth when its potential productive increases due to an increase in the quantity or quality of available factors of production, as shown by point B in the illustration.
Conversely, economic decline occurs when there is a reduction in the quantity or quality of available factors of production, as depicted by point A in the illustration.
Natural disasters can be a contributing factor to economic decline, as they can lead to a reduction in available resources and, consequently, a decrease in the production of goods and services. For example, natural disasters can damage infrastructure, deplete natural resources, and reduce the availability of labor and capital, all of which can negatively impact an economy's productive potential.
Changes in the quantity of resources can affect a country's production possibilities.
For example, an increase in the quantity of labor due to the net immigration of working-age people, a higher proportion of women entering the workforce, or an increase in the retirement age can lead to an expansion in the production possibilities.
Similarly, the purchase of extra capital goods, known as net investment, increases the quantity of capital goods and causes the PPC to shift rightwards.
Changes in the quality of resources can also affect a country's production possibilities.
Education and training improvements can enhance labor quality and raise productivity, leading to a shift to the right in the PPC.
Advancements in technology can improve the quality of capital goods, leading to a rightward shift in the PPC.
The quality of the enterprise can be raised through management training and improved education, which can also result in a rightward shift in the PPC.

If an increase in the quality or quantity of resources only benefits the production of one of the products only that side of the PPC will move outward. For instance, if new fertilizing techniques or improved human capital for farm workers benefit corn production but not robots, the corn side of the PPC will shift outward. This shift would increase the opportunity costs of producing robots while decreasing the opportunity costs for producing corn. In other words, as more resources are allocated to corn production, the opportunity cost of producing robots increases because the resources that could have been used for robot production are being used to produce corn instead.